FAQs
FAQs
The original data presented on this website come from the study “Premature mortality due to air pollution in European cities; an Urban Burden of Disease Assessment” (Khomenko et al., 2021), published in The Lancet Planetary Health in January 2021. The air pollution ranking was updated in November 2021 with data from “Health impacts of the new WHO air quality guidelines in European cities” (Khomenko et al., The Lancet Planetary Health, 2021).
The data on source contribution to air pollution-related mortality for each city come from the paper Spatial and sector-specific emissions contribution to ambient air pollution and mortality in European cities (Khomenko et al., 2023), published in The Lancet Public Health.
From the Urban Audit 2018 dataset:
https://ec.europa.eu/eurostat/web/gisco/geodata/reference-data/administrative-units-statistical-units/urban-audit
Air pollution levels were estimated using three different mathematical and empirical models. Values given by the models were checked against actual air pollution measures extracted from the European air quality database AirBase. The data used in the study take 2015 as the reference year and were also compared to 2018 for temporary decreases in air pollution levels.
This air pollution ranking includes 858 European cities. The city ranked #1 has the worst mortality data related to air pollution, while the city ranked #858 has the best mortality data.
The air pollution ranking is based on a mortality burden score assigned to each city. Scores were calculated using an algorithm that takes into account the mortality rates, the percentage of preventable mortality and the years of life lost due to each air pollutant.
The study assessed 969 cities and 47 greater cities in 31 European countries. Greater cities are larger urban areas within a metropolitan area.
Larger cities usually have a metropolitan area that includes other cities. Researchers considered metropolitan areas as part of the same urban area and decided to pool all the cities within them. The total number of cities resulting from this operation is 858. Cities included within a greater city do not appear in the ranking but can be found using the search box.
Fine particulate matter or PM2.5 is one of the main air pollutants. All PM particles are particulate matter containing a mixture of solid and liquid elements suspended in the air, including particles of dust, metals, cement and organic matter. They are classified by particle size, measured in micrometres (thousandths of a millimetre): the smaller the particles, the more easily they can penetrate our bodies. PM2.5 are fine particles with a diameter between 0.1 and 2.5 µm. They can penetrate the respiratory system as far as the pulmonary alveoli. One component of PM2.5 is black carbon, a product of incomplete combustion, especially of diesel fuel. The main sources of PM2.5 in cities include traffic, local fuel combustion from household heating, industrial combustion, and wood and coal burning.
NO2 or nitrogen dioxide is one of the main air pollutants: a toxic irritant gas that affects the respiratory system. NO2 can irritate the airways in the human respiratory system, aggravating respiratory diseases (such as asthma) and leading to increased hospital admissions and visits to emergency rooms. In the long term, NO2 exposure can lead to the development of asthma and increase susceptibility to respiratory infections. Its main source is motor vehicle emissions, particularly from diesel engines (the older they are, the more they pollute). NO2 levels are generally higher in cities due to their higher volume of traffic and are usually related to the way cities are designed.
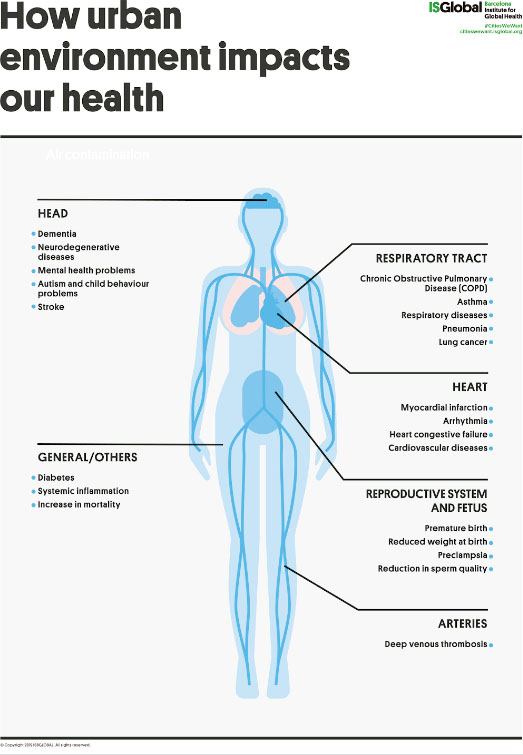
Due to its capacity to penetrate the bloodstream and cause inflammation, air pollution has the potential to damage almost every organ in the body. There is evidence that links air pollution to respiratory problems, heart disease, cancer, dementia, fertility problems and reduced cognitive function.
Air pollution peaks can exacerbate the symptoms of people with underlying conditions such as asthma or at risk of suffering heart attacks or strokes.
Chronic air pollution increases the risk of cardiovascular and respiratory diseases. Children exposed to higher levels of air pollution show slower cognitive development and more exposed adults show a higher risk of cognitive decline. Higher exposure to air pollution also increases the risk of preterm birth and low birth weight.
For more information, visit https://www.isglobal.org/en/ciudadesquequeremos#efectossalud
Avoidable deaths can be defined as the fraction of mortality that could be prevented each year if a particular risk factor was not present in the population. In this study, the avoidable deaths can be interpreted as the number of deaths that could be prevented each year if exposure to air pollution were reduced (in the case of the WHO recommendations) or almost eliminated (in the case of the lowest measured levels) as a risk factor for mortality.
To calculate the number of avoidable deaths, the study uses city-specific natural-cause mortality data for 2015 from the Eurostat database and applies the most recent and robust scientific evidence on the relationship between air pollution levels and mortality. The study follows a comparative risk assessment approach by comparing current air pollution levels in cities to two theoretical air-pollution reduction scenarios (WHO recommendations and lowest measured levels). The number of preventable deaths is estimated as a function of these reductions and the scientific evidence on the relationship between air pollution and mortality.
Based on the existing scientific evidence, in September 2021 the World Health Organization (WHO) set new recommended limits for concentration of air pollutants. According to these guidelines, outdoor concentrations of PM2.5 should not exceed an annual mean value of 5 µg/m3. The outdoor recommended limit for NO2 concentrations is 10 µg/m3.
Although these guidelines are considered the gold standard for the protection of human health, they are just recommendations and not mandatory.
The original study that led to our Air Pollution Rankings was based on the previous WHO Global Air Quality Guidelines, which had been published in 2005 and set less ambitious reference levels (10 µg/m3 for PM2.5 and 40 µg/m3 for NO2. The current version of the website includes the number of annual premature deaths that could be avoided meeting both the new and the former WHO guidelines.
For more information, visit https://apps.who.int/iris/handle/10665/345329
European legislation establishes the maximum air pollution levels allowed in the EU. In the case of PM2.5, annual mean concentrations should not exceed 25 µg/m3. The annual limit for NO2 concentrations is 40 µg/m3.
For more information, visit https://ec.europa.eu/environment/air/quality/standards.htm
European standards are set by EU legislation and are mandatory for all member states. WHO guidelines are just recommendations. The maximum reference levels of air pollution recommended by the WHO are much more restrictive—and therefore provide better health protection—than the EU legislation, especially after the update of the WHO Global Air Quality Guidelines published in September 2021.
Air Pollution Maximum Levels (annual mean)
PM2.5 / New 2021 WHO Guidelines: 5 µg/m3
PM2.5 / 2005 WHO Guidelines: 10 µg/m3
PM2.5 / EU directives: 25 µg/m3
NO2 / New 2021 WHO Guidelines: 10 µg/m3
NO2 / 2005 WHO Guidelines: 40 µg/m3
NO2 / EU directives: 40 µg/m3
For more information, visit https://www.eea.europa.eu/themes/air/air-quality-concentrations/air-quality-standards
The study considered the WHO guidelines because the maximum recommended level for PM2.5 and NO2 concentrations are lower in the WHO guidelines than in the EU legislation and therefore provides more health protection.
The WHO guidelines are considered the gold standard for the protection of human health.
There is no scientific evidence suggesting that there is a particular threshold below which air pollution does not affect health. Recent studies have reported associations between air pollution and mortality at levels below the WHO thresholds. Greater reductions in air pollution levels are expected to offer larger health benefits.
The data presented in this study show that more deaths could be prevented if air pollution levels were lowered below the current WHO thresholds.
The fact that the average air pollution levels of a city are below the guidelines doesn’t mean the whole city is below those levels. Certain areas of the city may have air pollution levels above the thresholds. In these cases, our study shows the deaths that could be prevented if those areas of the city also met the WHO recommendations.
The green space and health data presented on this website come from the study “Green space and mortality in European cities: a health impact assessment study” (Pereira Barboza et al., 2021), published in The Lancet Planetary Health in October 2021.
From the Urban Audit 2018 dataset:
https://ec.europa.eu/eurostat/web/gisco/geodata/reference-data/administrative-units-statistical-units/urban-audit
The NDVI levels were obtained using the Terra Moderate Resolution Imaging Spectroradiometer Vegetation Indices (MOD13Q1) from the US Geological Survey.
%GA data for 922 cities and 47 greater cities were obtained from the European Urban Atlas 2012. For 39 cities and one greater city in the UK data were retrieved from the UK Land Cover Map 2015. For 17 cities and one greater city, data were retrieved from the Corine Land Cover 2012 inventory.
For both measures, green space data was estimated at the grid-cell level (250 m x 250 m resolution). To reflect the WHO recommendation of residential exposure to green spaces, the total averaged NDVI value was estimated by adding a 300 m buffer around each grid cell to indicate the proximity to greenness (ie, about 5 min walk along walkable pathways).
The green space ranking lists European cities by their mortality burden attributable to the lack of green space. The city ranked #1 has the highest mortality burden attributable to lack of green space, while the city ranked #866 has the lowest mortality burden.
The ranking is composed of two different lists, one for each of the green space indicators used in our study (NDVI and %GA). Each list estimates the burden of mortality attibutable to that particular green space indicator.
The green space ranking is based on a mortality burden score assigned to each city. Scores were calculated using an algorithm that takes into account the mortality rates, the percentage of preventable mortality and the years of life lost due to the lack of green space.
The study assessed 978 cities and 49 greater cities in 31 European countries. Greater cities are larger urban areas within a metropolitan area.
Larger cities usually have a metropolitan area that includes other cities. Researchers considered metropolitan areas as part of the same urban area and decided to pool all the cities within them. The total number of cities resulting from this operation is 866. Cities included within a greater city do not appear in the ranking but can be found using the search box.
The percentage of Green Area (%GA) is an indicator that measures the surface of land that is officially defined as a green space. It usually refers to public spaces such as parks, squares or community gardens.
The Normalized Difference Vegetation Index (NDVI) is an indicator that measures live vegetation of a specific area. It considers all kinds of vegetation, including street trees and private gardens. It is measured in values that range from -1 to 1, with positive and higher values indicating more greenness. Given that negative values represent water and ice, which were not included in the study, the bar graphic in the website goes from 0 to +1.
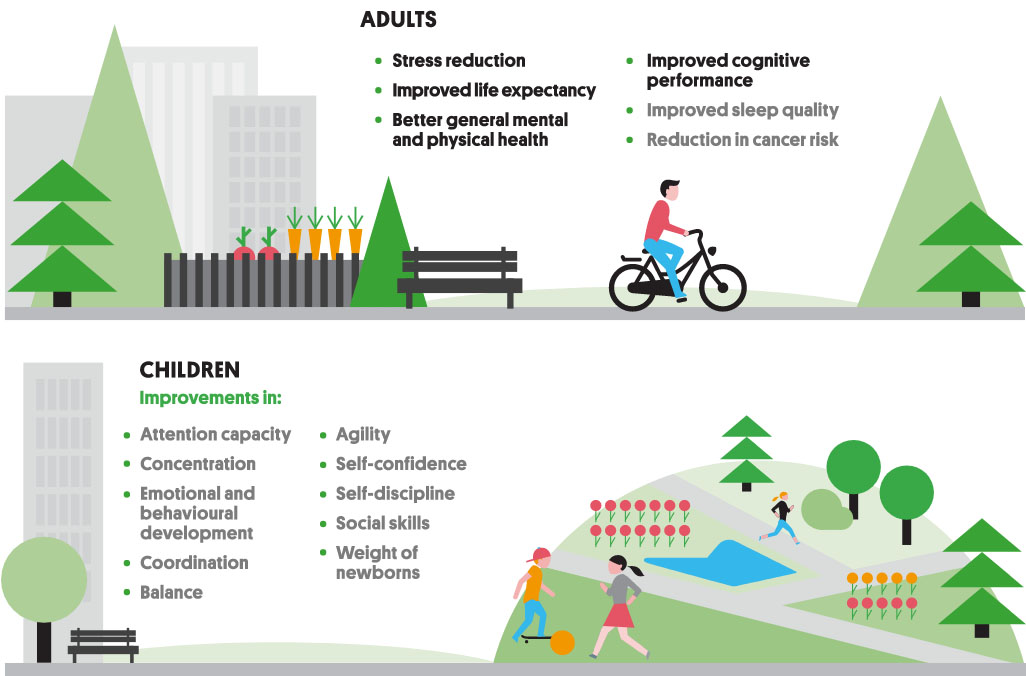
Natural outdoor environments including green spaces play an important role in preserving population health and wellbeing in cities and provide ecosystem services and ecological benefits, besides having recreational, social, and cultural values. Many studies have associated green space with beneficial health effects, including enhanced restoration, improved perceived wellbeing and mental health, reduction in cardiovascular disease, and with decreased natural-cause mortality.
Avoidable deaths can be defined as the fraction of mortality that could be avoided each year if a particular risk factor was not present in the population. In this study, the avoidable deaths can be interpreted as the number of deaths that could be prevented each year if exposure to green spaces was enough to meet the WHO recommendation and, thus, reach universal access to green spaces.
To calculate the number of avoidable deaths, the study uses city-specific natural-cause mortality data for 2015 from the Eurostat database and applies the most recent and robust scientific evidence on the relationship between exposure to green space and mortality. The study follows a comparative risk assessment approach by comparing current green space levels in cities to a theoretical model in which the WHO recommendation on access to green space would be reached. The number of preventable deaths is estimated as a function of these increases in the availability of green spaces and the scientific evidence on the relationship between exposure to green space and reduction in mortality.
WHO recommends that green spaces of at least 0.5 hectares should be accessible within a 300 m linear distance of residences.
For more information, visit https://www.euro.who.int/en/health-topics/environment-and-health/urban-health/publications/2016/urban-green-spaces-and-health-a-review-of-evidence-2016
The authors of the ranking have divided urban areas into 250×250 m grids. Based on previous studies they have estimated that each of the grids should have 25% of Green Area (%GA) to comply with WHO recommendation on exposure to green space.
In the case of NDVI, the authors have used mathematical models to establish which is the value that would result in compliance with the recommendations for each city.
Given that NDVI generally represents the total amount of live green vegetation (eg, street trees, green corridors, and general vegetation from public and private spaces), positive and higher NDVI values indicate more greenness. However, it is important to consider that the natural characteristics of each city (eg, latitude, type of landscape, weather, etc.) can influence the natural vegetation (by variations in type and density), and, consequently, the NDVI value that its vegetation presents.
In this sense, the authors have used mathematical models in a way to consider the possible geographical, climatic, and biological variations in vegetation when determining each city’s NDVI levels (eg, cities in Southern Europe having naturally different NDVI levels than cities in Northern Europe).
The fact that the average %GA or NDVI levels of a city are above the guidelines doesn’t mean the whole city is above those levels. While certain areas of the city may have big parks, squares and high amounts of green vegetation, other areas of the city may have %GA and NDVI levels below the thresholds or even no green at all. In these cases, our study shows the deaths that could be prevented if those areas of the city also met the WHO recommendation.
The noise data presented on this website come from the study “Impact of road traffic noise on annoyance and preventable mortality in European cities: a health impact assessment“, published in Environment International in 2022.
From the Urban Audit 2018 dataset:
https://ec.europa.eu/eurostat/web/gisco/geodata/reference-data/administrative-units-statistical-units/urban-audit
Road traffic noise exposure was estimated using noise maps delivered by the countries and cities under the current European legislation (the Environmental Noise Directive) or available from local sources (such as city halls and research institutions). When cities within a country had missing data, a predictive model was developed and applied to estimate road traffic noise exposure.
The data on road traffic noise exposure presented high variability in formats, quality and methods to estimate noise exposure. Accordingly, the research team considered that the obtained estimates for cities were not comparable and that a ranking could be misleading.
The study assessed 724 cities and 25 greater cities in 25 European countries. The remaining cities could not be included due to lack of data. Greater cities are larger urban areas within a metropolitan area.
Population exposure to road traffic noise was calculated using three data sources: a European-wide population dataset at a resolution of 250 metres, a European-wide building-type dataset containing information on residential buildings and the noise maps. For each city, the population was distributed among the buildings. The population in each building was assigned a noise exposure equivalent to the exposure values shown in the intersecting fragment of the corresponding noise map.
When cities within a country had missing data, a predictive model to estimate exposure to road traffic noise was constructed. The model is built using data from other cities’ noise maps and takes into consideration other variables such as the road network and the city population and size.
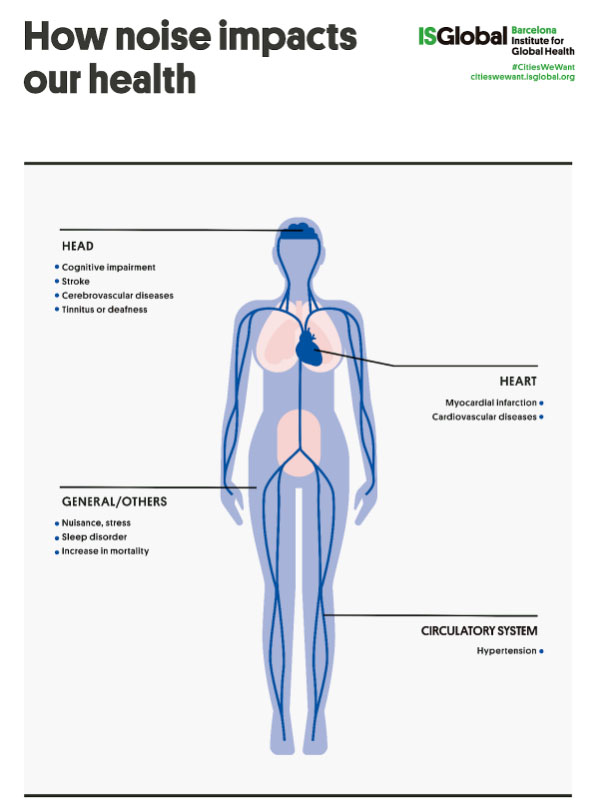
Road traffic noise has been associated with many detrimental health effects. Prolonged exposure to road traffic noise can cause a sustained stress reaction, resulting in the release of stress hormones, increases in the heart rate, blood pressure and vasoconstriction, eventually leading to chronic diseases such as cardiovascular disease. A prolonged activation of the stress response can also result in the development of depression and anxiety disorders, having a negative effect on mental health, wellbeing and quality of life.
Two primary health pathways through which road traffic noise can affect the quality of life are annoyance and sleep disturbance. Annoyance results from a repeated disturbance of daily activities (such as communicating, reading, working or sleeping), anger, negative evaluation of the noise source and distress, and can enhance the stress response. Sleep disturbance impairs a proper sleep restoration, which is a precursor for many diseases such as obesity, diabetes, high blood pressure and dementia.
Noise annoyance can be defined as a state of irritation resulting from a continued exposure to a noise source. To evaluate the relation between exposure to noise and annoyance standard annoyance questionnaires and scales are used. In these questionnaires, respondents are classified as highly annoyed when they choose a high position on the annoyance response scale. Thus, “high noise annoyance” describes the fraction of the population with the worst annoyance outcomes due to road traffic noise.
Avoidable deaths can be defined as the fraction of mortality that could be prevented each year if a particular risk factor was not present in the population. In this study, the avoidable deaths can be interpreted as the number of deaths that could be prevented each year if population exposure to road traffic noise was reduced to the WHO recommendation of 53 dB Lden.
To calculate the proportion of the highly annoyed population, the study employed the most recent and robust scientific evidence on the relationship between exposure to road traffic noise and high annoyance. For each city, this relationship was applied to calculate the expected proportion of the highly annoyed population based on the population exposure to road traffic noise.
To calculate the number of avoidable deaths, the study uses city-specific data on mortality from Ischaemic Heart Disease (IHD) causes for 2015 from the Eurostat database and applies the most recent and robust scientific evidence on the relationship between road traffic noise levels and mortality from IHD. The study follows a comparative risk assessment approach by comparing current population exposure to road traffic noise to a theoretical reduction to WHO recommended levels. The number of avoidable deaths is estimated as a function of these reductions and the scientific evidence on the relationship between road traffic noise and mortality from IHD.
In this study, only deaths from Ischaemic Heart Disease (IHD) causes were included based on the most robust and strong evidence that exists for exposure to road traffic noise and the development of cardiovascular disease, in particular, Ischaemic Heart Disease (IHD). The research team focused on mortality from IHD causes, following an accepted methodology outlined in the “Environmental Noise in Europe” report from the European Environment Agency (EEA), published in 2020.
For more information, visit: https://www.eea.europa.eu/publications/environmental-noise-in-europe
Based on the existing scientific evidence, in 2018 the World Health Organization (WHO) published the “Environmental Noise Guidelines for the European Region”, setting recommendations to protect human health from environmental noise originating from transport (road traffic, railways and aircrafts), wind turbines and leisure activities. The recommendation for noise from road traffic is to reduce the average 24-hours exposure below 53 dB Lden.
These guidelines are considered the gold standard for the protection of human health given the current evidence on the health effects of noise. However, these are not mandatory and remain as recommendations.
For more information, visit: https://www.euro.who.int/en/health-topics/environment-and-health/noise/publications/2018/environmental-noise-guidelines-for-the-european-region-2018
Lden is an indicator of noise exposure that accounts for long-term exposure to noise, based on noise levels over a whole day (24 hours), with penalties for night-time (from 23.00 to 7.00 hours) and evening (from 19.00 to 23.00 hours) noise levels.
Even though the World Health Organization (WHO) recommends reducing exposure to road traffic noise below 53 dB Lden, the majority of noise maps only include exposure levels starting at 55 dB Lden. To conduct a harmonized analysis for all cities the research team calculated population exposure to road traffic noise starting 55 dB Lden, in accordance with the available data.
In the European Union (EU), the main legislative framework for noise control is the Environmental Noise Directive (END). Under the END the member states are required to:
- Produce noise maps every five years for all major roads, railways, airports and cities.
- Calculate the number of people exposed to each noise source (road traffic, railways and aircrafts) inside and outside cities.
- Develop action plans to prevent and reduce noise exposure, particularly in areas where it can have detrimental effects on human health.
The END is an instrument that helps to identify the main noise sources and allows the development of adequate measures to address its negative effects. However, there is no regulation on maximum allowed population exposure levels. Individual actions are taken by member states’ authorities.
For more information, visit: https://ec.europa.eu/environment/noise/directive_en.htm
Based on the current scientific evidence on the health effects of road traffic noise, negative health effects at levels below the World Health Organization (WHO) guideline values cannot be disregarded. Further research is needed to evaluate the existence of an exposure threshold at which detrimental health effects start to build up.
The contributions of each of the emission sources to the concentrations of pollutants were estimated using the Screening for High Emission Reduction Potentials for Air quality (SHERPA) tool, a software developed by the Joint Research Centre (JRC), which applies, in a simplified way, the principles of the so-called chemical transport models. These models take into account factors such as meteorology and chemical transformations to simulate the concentration of pollutants in the atmosphere. The research team divided the surface area of the European cities into 36 km2 grids. Using SHERPA, they estimated the changes in atmospheric concentrations of PM2.5 and NO2 that would occur if emissions were reduced in each of the grids on the map and calculated the relative contributions of each of the pollution sources.
Finally, a comparative risk assessment was carried out to estimate the mortality attributable to each air pollution source, using the relative changes in pollutant concentrations that would result from reducing each emission source.
If the data for all cities are aggregated, the figures show that the largest contributor to PM2.5 -related mortality is residential emissions, with a mean of 22.7% of total mortality. In second place is the agricultural sector, which accounts for 18% of PPM2.5 mortality, followed by industry (13.8%), transport (13.5%), the energy sector (10%), natural sources (8.8%) and maritime transport (5.5%).
Overall, the transport sector is the main contributor to NO2-related mortality, with a mean of 48.5% of the total. Other sectors with important contributions are industry with a mean contribution of 15%, the energy sector with 14.7%, housing (10.3%) and maritime transport (9.7%).
The Healthy Urban Design Index (HUDI) assesses the extent to which the way European cities are configured supports health. It examines 13 indicators from around 1,000 cities and establishes a score for each of them, as well as an overall score for each city.
The data come from the study “Building a Healthy Urban Design Index (HUDI): how to promote health and sustainability in European cities” (F. Montana et al,), published in The Lancet Planetary Health in 2025.
The score is a numerical value (0-10) representing the city’s average performance on 13 healthy urban design indicators. Higher scores indicate better performance.
The ranking shows the position of each city within its category by number of inhabitants, followed by the total number of cities in that category. The position in the ranking is calculated from the average score on the 13 indicators assessed.
It’s a score between 0 and 10 based on the number of dwellings per hectare. Higher scores indicate a more optimal population density.
It’s a score between 0 and 10 based on the concentration of buildings and urban development. Higher scores indicate more compact cities.
It’s a score between 0 and 10 based on the percentage of buildings with 5-6 stories. Higher scores indicate a higher % of mid-rise buildings.
It’s a score between 0 and 10 based on the permeability of the soil. Higher scores indicate more permeable surfaces.
It’s a score between 0 and 10 based on the percentage of road network dedicated to pedestrian infrastructure. Higher scores indicate a higher percentage.
It’s a score between 0 and 10 based on the percentage of cycling infrastructure. Higher scores indicate more cycling infrastructure.
It’s a score between 0 and 10 based on the percentage of population living within 300 meters of a public transport stop. Higher scores indicate higher percentage.
It’s a score between 0 and 10 based on the city’s levels of the air pollutant PM2.5. Higher scores indicate cleaner air.
It’s a score between 0 and 10 based on the city’s levels of the air pollutant NO2. Higher scores indicate cleaner air.
It’s a score between 0 and 10 based on the average Normalised Difference Vegetation Index (NDVI) around the city (or the amount of green vegetation). Higher scores indicate more vegetation.
It’s a score between 0 and 10 based on the urban heat island effect. Higher scores indicate less urban heat island effect.
It’s a score between 0 and 10 based on the percentage of population living within 300 meters of a green space of at least 0.5 hectares. Higher scores indicate better access.
It’s a score between 0 and 10 based on the percentage of the population living within 2 km of a green area of 5 hectares or more. Higher scores indicate higher % of population.
HUDI cities are divided into 5 categories based on population size and density (large metropolitan areas, metropolitan areas, medium-size urban areas, small urban areas and small towns).
Cities or agglomerations of cities with a population of 1.5 million inhabitants or more.
Cities or agglomerations of cities with a population of between 500,000 and 1.5 million.
Cities with a population of between 200,000 and 500,000.
Cities with a population of between 50,000 and 200,000.
Urban areas with less than 50,000 inhabitants.
 Search another city