 RANKING POSITION
 ![]() Category: Medium-size urban areas
Category: Medium-size urban areas
173/177
 AVERAGE SCORE
 ![]()
4.23/10
 INDICATOR SCORES
 ![]()
Urban Design
Green Accessibility
Environment
Transportation
 INDICATOR SCORES
 ![]()
 SPECIFIC VALUES
 Dwelling density:
10,28 dwellings per hectare. The number of dwellings per hectare considered optimal is between 45 and 175. Compactness:
46 points (out of 100), based on the concentration of buildings and urban development. Higher scores indicate more compact cities Mid-rise development:
72,9% of buildings with 5-6 stories. Permeability:
51,91% of people with access to the target level of permeable surfaces. Opportunity to walk:
22,2% of walking infrastructure (versus total road length). Opportunity to cycle:
2,29% of cycling infrastructure (versus total road length). Public transport stops:
14,8% of population with access to at least one bus stop within a 300 m buffer from home.
 Air quality (PM2.5):
14,1 µg/m³ (mean annual levels). Air quality (NO2):
19,16 µg/m³ (mean annual levels). Surrounding greenness:
47,14% of people with access to the target value of NDVI. Urban heat islands:
-0,36 points on a scale between -8 and 7 based on the urban heat island effect, where higher values indicate higher urban heat island effect. Universal access to green spaces:
24,94% of people with access to a green space of at least 0.5 ha within 300m of their home. Access to large green spaces:
21,99% of people with access to a green space of at least 5 ha within 2 km of their home.
 MAPS *
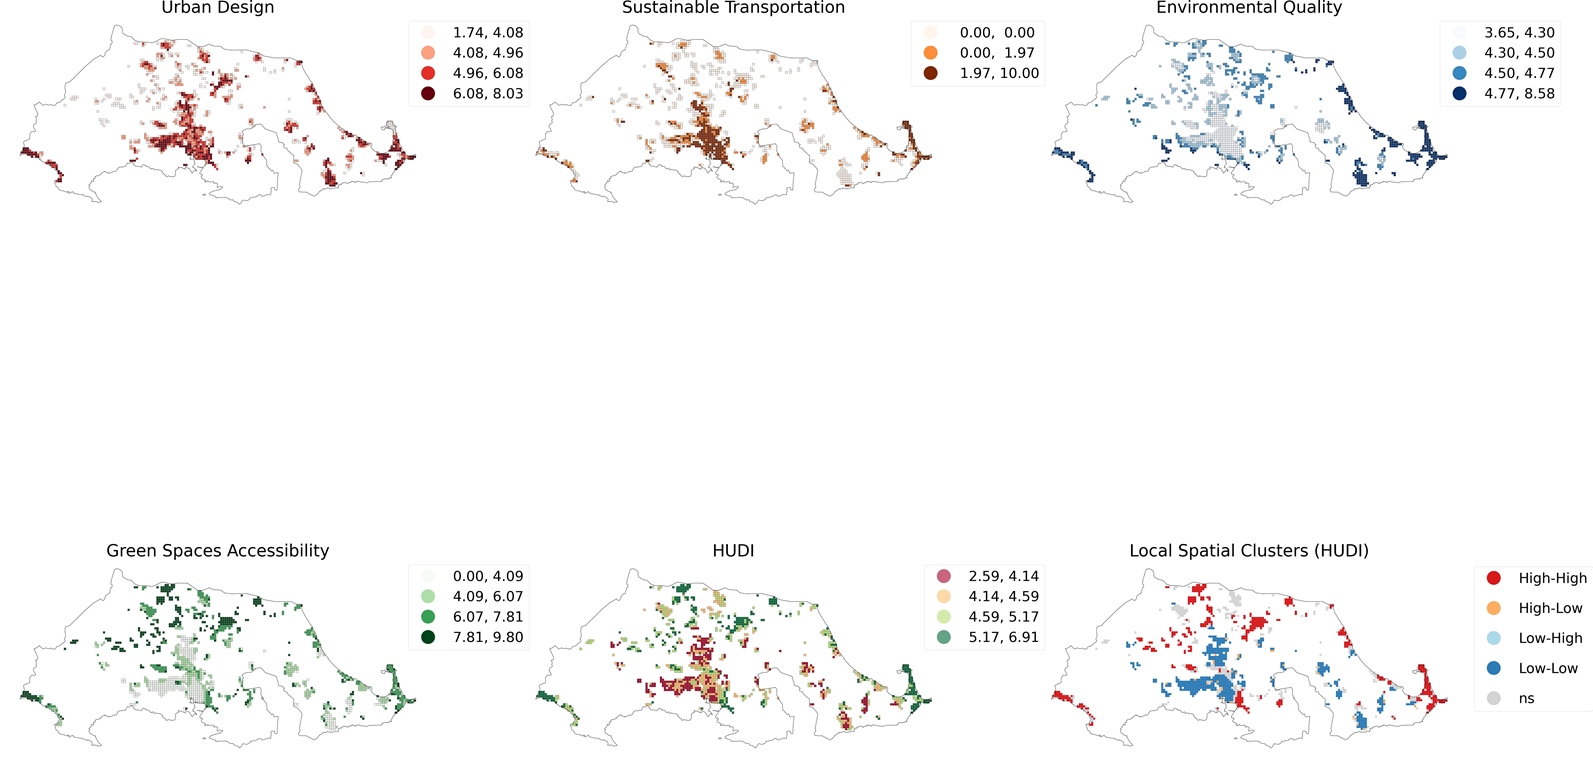
The first four maps illustrate the spatial distribution of indicator scores across four domains—urban design, sustainable transportation, environmental quality, and green space accessibility—within the defined municipal area, measured at a 250 m×250 m grid cell resolution. Darker colors represent better scores in each domain.
The fifth map presents the overall HUDI score, derived from a combination of all 13 indicators. In this map, darker green shades indicate better overall performance.
The sixth map-local Moran's analysis-identifies spatial clusters of high and low indicator scores, highlighting areas of concentration.
Legend values correspond to the combined scores for the indicators listed in the table above.