 RANKING POSITION
 ![]() Category: Metropolitan areas
Category: Metropolitan areas
 AVERAGE SCORE
 ![]()
 INDICATOR SCORES
 ![]()
 INDICATOR SCORES
 ![]()
 SPECIFIC VALUES
 Dwelling density:
48,54 dwellings per hectare. The number of dwellings per hectare considered optimal is between 45 and 175. Compactness:
94 points (out of 100), based on the concentration of buildings and urban development. Higher scores indicate more compact cities Mid-rise development:
96,55% of buildings with 5-6 stories. Permeability:
15,57% of people with access to the target level of permeable surfaces. Opportunity to walk:
17,99% of walking infrastructure (versus total road length). Opportunity to cycle:
9,14% of cycling infrastructure (versus total road length). Public transport stops:
25,39% of population with access to at least one bus stop within a 300 m buffer from home.
 Air quality (PM2.5):
13,85 µg/m³ (mean annual levels). Air quality (NO2):
26,16 µg/m³ (mean annual levels). Surrounding greenness:
25,48% of people with access to the target value of NDVI. Urban heat islands:
0,43 points on a scale between -8 and 7 based on the urban heat island effect, where higher values indicate higher urban heat island effect. Universal access to green spaces:
45,35% of people with access to a green space of at least 0.5 ha within 300m of their home. Access to large green spaces:
71% of people with access to a green space of at least 5 ha within 2 km of their home.
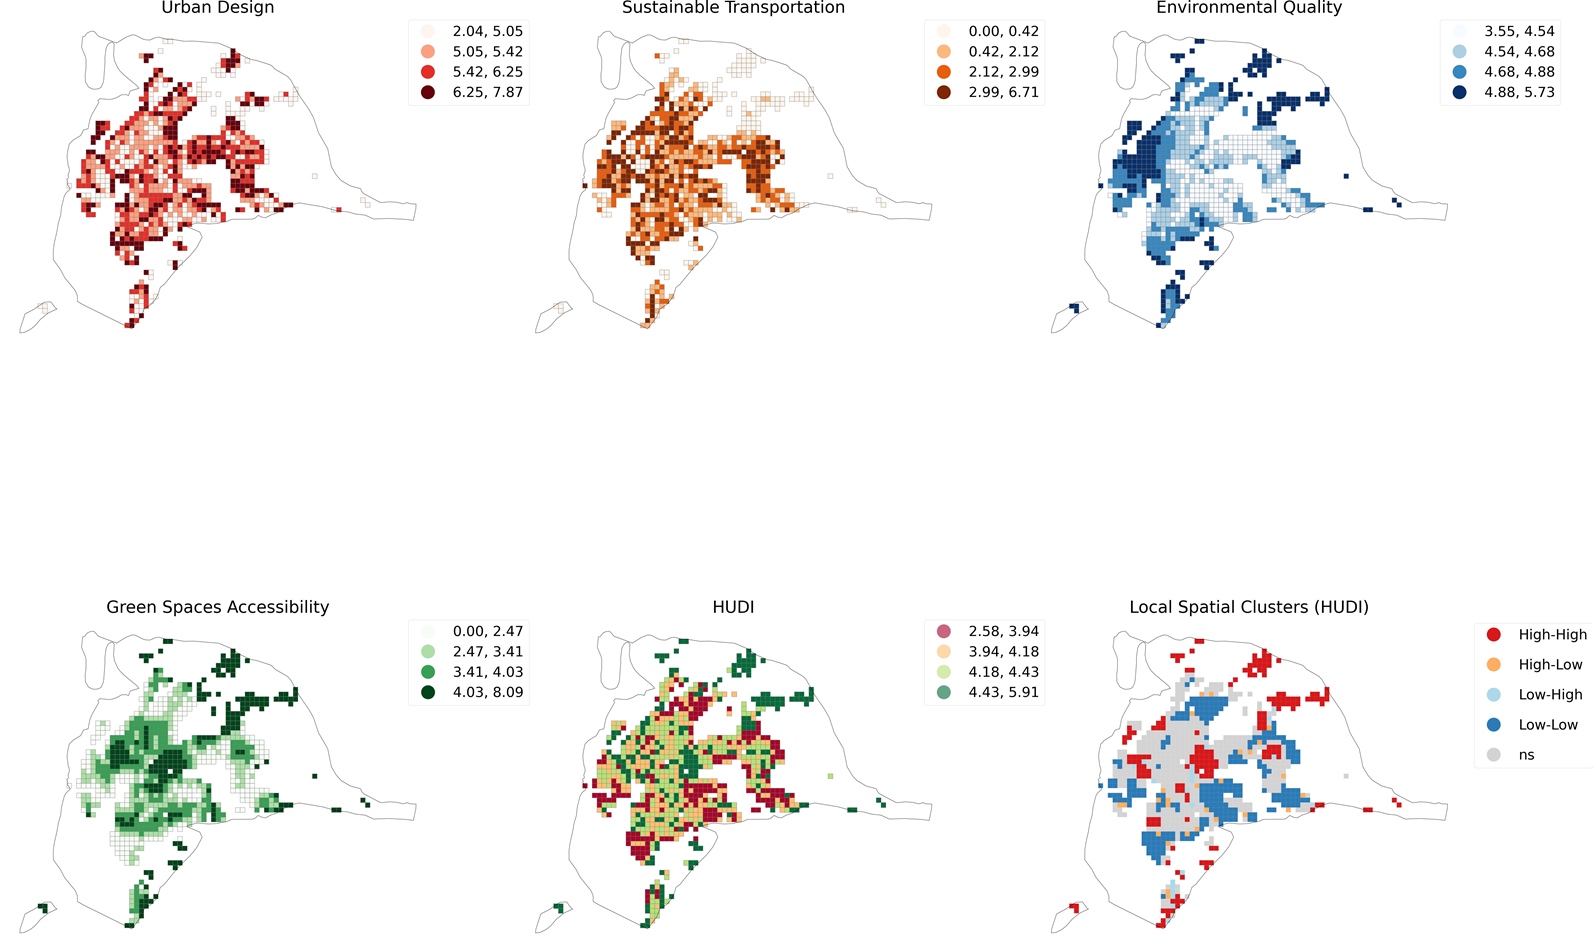
 MAPS *
SHARE THE RESULTS
Federica Montana, Natalie Mueller, Evelise Pereira Barboza, Sasha Khomenko, Tamara Iungman, Marta Cirach, Carolyn Daher, TC Chakraborty, Kees de Hoogh, Alice Battiston, Rossano Schifanella, Mark Nieuwenhuijsen. Building a Healthy Urban Design Index (HUDI): how to promote health and sustainability in European cities. The Lancet Planetary Health, June 2025.
DOI: 10.1016/S2542-5196(25)00109-3
https://linkinghub.elsevier.com/retrieve/pii/S2542519625001093