RANKING POSITION Category: Small urban areas

343/638

AVERAGE SCORE

5.22/10

INDICATOR SCORES

Urban Design
Green Accessibility
Environment
Transportation

INDICATOR SCORES

0-3
3-6
6-9
9-10

SPECIFIC VALUES

  • Dwelling density:
    27,94 dwellings per hectare. The number of dwellings per hectare considered optimal is between 45 and 175.
  • Compactness:
    88 points (out of 100), based on the concentration of buildings and urban development. Higher scores indicate more compact cities
  • Mid-rise development:
    92,16% of buildings with 5-6 stories.
  • Permeability:
    32,55% of people with access to the target level of permeable surfaces.
  • Opportunity to walk:
    18,4% of walking infrastructure (versus total road length).

  • Opportunity to cycle:
    3,96% of cycling infrastructure (versus total road length).
  • Public transport stops:
    30,43% of population with access to at least one bus stop within a 300 m buffer from home.
  • Air quality (PM2.5):
    13,82 µg/m³ (mean annual levels).
  • Air quality (NO2):
    25,65 µg/m³ (mean annual levels).
  • Surrounding greenness:
    39,31% of people with access to the target value of NDVI.
  • Urban heat islands:
    0,05 points on a scale between -8 and 7 based on the urban heat island effect, where higher values indicate higher urban heat island effect.
  • Universal access to green spaces:
    41,8% of people with access to a green space of at least 0.5 ha within 300m of their home.
  • Access to large green spaces:
    41,48% of people with access to a green space of at least 5 ha within 2 km of their home.

MAPS *

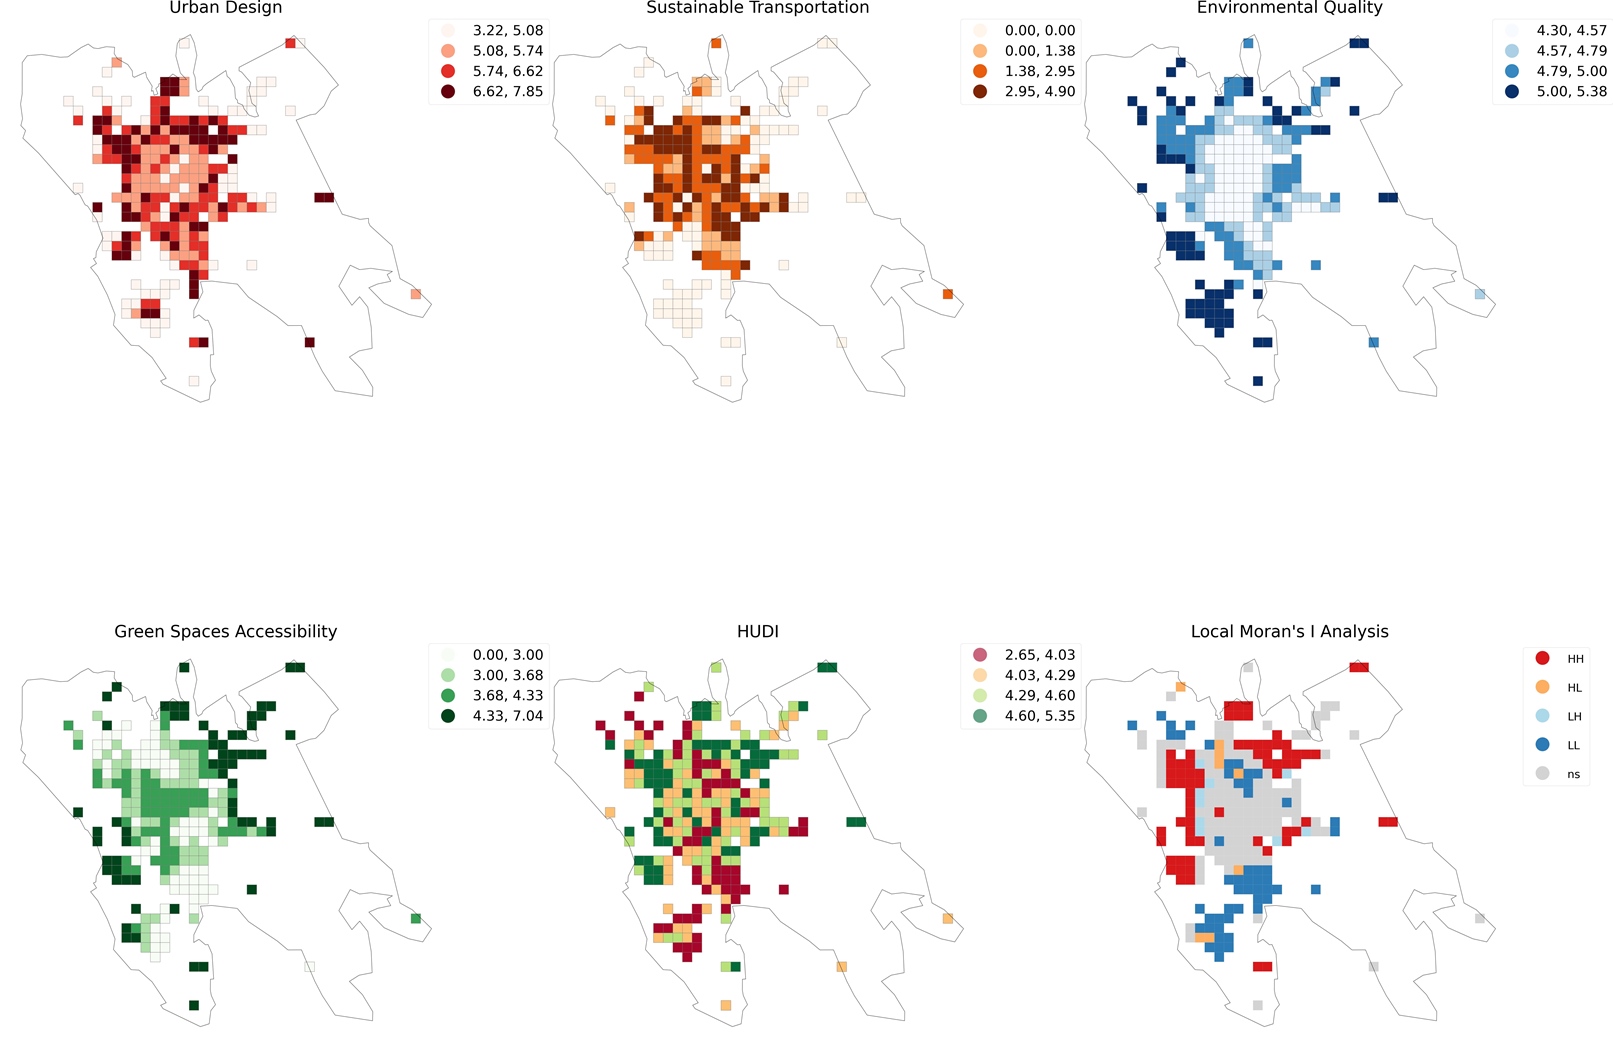
The first four maps illustrate the spatial distribution of indicator scores across four domains—urban design, sustainable transportation, environmental quality, and green space accessibility—within the defined municipal area, measured at a 250 m×250 m grid cell resolution. Darker colors represent better scores in each domain.
The fifth map presents the overall HUDI score, derived from a combination of all 13 indicators. In this map, darker green shades indicate better overall performance.
The sixth map-local Moran's analysis-identifies spatial clusters of high and low indicator scores, highlighting areas of concentration.
Legend values correspond to the combined scores for the indicators listed in the table above.

SHARE THE RESULTS

Federica Montana, Natalie Mueller, Evelise Pereira Barboza, Sasha Khomenko, Tamara Iungman, Marta Cirach, Carolyn Daher, TC Chakraborty, Kees de Hoogh, Alice Battiston, Rossano Schifanella, Mark Nieuwenhuijsen. Building a Healthy Urban Design Index (HUDI): how to promote health and sustainability in European cities. The Lancet Planetary Health, June 2025.
DOI: 10.1016/S2542-5196(25)00109-3
https://linkinghub.elsevier.com/retrieve/pii/S2542519625001093